


Football games are often won and lost in the kicking game. This part of the game affects field position and scoring chances. It’s called “hidden yards.”
Today’s football is all about data. Coaches make decisions based on numbers and expected points. This approach moves beyond just feeling to actual facts.
The University of Florida Gators often win by focusing on special teams. Punt, kickoff, and field goal performances are key. Tracking the right metrics gives them an edge.
Knowing these numbers changes how fans see the game. It shows the importance of a good punt or a long kickoff return. This analysis helps understand what makes special teams successful. For advanced analysts and members of a sharp sports betting forum, tracking these hidden metrics is often what separates an accurate prediction from a losing line.
Metric Glossary: net field position, make probability, return EPA
Net field position, make probability, and return EPA are key in special teams analysis. They replace guesses with real data. This helps us see how well teams perform, not just by yardage.
Knowing these terms lets fans understand the game’s hidden aspects. This glossary gives us the exact words for detailed analysis.
This metric shows which team gets the better field position after punts and kickoffs. It’s the average starting field position for a team’s defense after a punt or kickoff compared to the opponent’s.
A positive net means a defense is pinning opponents deep. Net punting is a big part of this. It looks at punt distance, return yards, and touchbacks. Good net punting makes the opposing offense face a long field.
Make Probability
Make probability shows how likely a field goal attempt will succeed. It goes beyond just making or missing. It uses past data on distance, weather, and kicker performance.
A 45-yard attempt in perfect weather has a higher make probability than a 53-yard try in bad weather. This helps coaches make informed fourth-down decisions, turning guesses into smart risks.
Return EPA (Expected Points Added)
Expected Points Added (EPA) values every play. Return EPA uses this for kick and punt returns. It shows the average points a return adds or takes away.
The calculation compares return results to the baseline of a touchback or fair catch. A return from the 15-yard line has negative kickoff return EPA. A return to the 40-yard line is positive. This metric, found in NFL analytics articles, shows the real effect of return decisions and blocking.
These three metrics focus on strategy over raw talent. They are the base for trusting data over stories. Learning this glossary is the first step to understanding special teams better.
Kicking Game: range bands, hash splits, end-of-half strategy
Field goal probability changes a lot with distance and field position. These ideas are key to understanding the kicking unit. Today, we use three main tools: range bands, hash splits, and end-of-half strategy.
Range bands show a kicker’s reliable distance. They help us predict success. Teams look at past performances to set up three main zones.
- High-Probability Band: Inside 40 yards. Success rates are often over 90%. This is very reliable.
- Moderate-Probability Band: Between 40 and 50 yards. Success rates range from 60% to 75%. This tests a kicker’s strength and consistency.
- Low-Probability Band: Over 50 yards. Success rates often drop below 50%. These kicks are risky but could pay off big.
These bands help us understand field goal probability during games. Coaches make decisions based on this data, not just instinct.
The second tool looks at hash splits. It checks if there’s a bias in accuracy based on the ball’s lateral position. Some kickers do better from certain spots on the field.
For example, a kicker might be five percentage points more accurate from the right hash. Another might struggle with kicks from the far left. Knowing these splits helps strategists plan better.
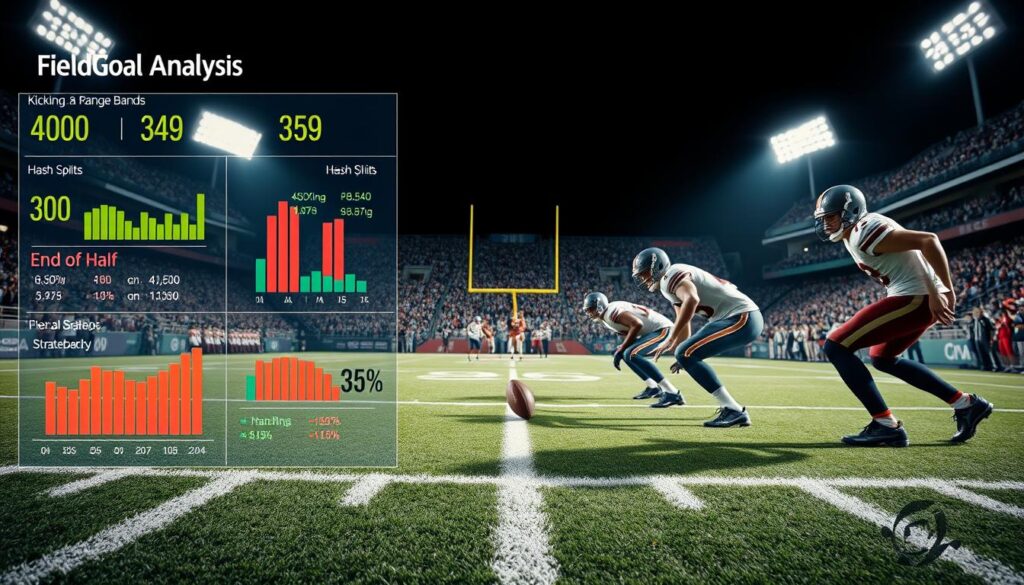
End-of-half strategy combines these tools for a big decision. Coaches have to choose between a long field goal, a timeout, or another play in the last seconds of a half.
The choice is based on data. It depends on time left, the score, and the kicker’s past performance. For instance, if the ball is at the 35-yard line with 5 seconds left, the math is clear.
A 52-yard attempt from a kicker with a 40% make rate in that low-probability band might not be the best choice. A timeout for a Hail Mary pass could be better. On the other hand, a 45-yard attempt from the 28-yard line in the high-probability band is often the right call.
This method takes emotion out of the decision-making. It bases strategy on real, historical data. The kicking game is now a series of calculated chances.
Punting: hang time, directional, inside-20 vs touchback math
Net punting averages and starting field position depend on a punter’s skills. They need to control hang time, direction, and placement. It’s not just about strength, but also about strategy and technique.
Hang time is how long the ball is in the air before it’s caught. It’s key for the coverage team. A 4.8-second hang time lets gunners cover 45 yards, limiting return options.
Directional punting is a smart move. It aims to pin the returner near the sideline. This limits their return lanes and affects the opponent’s play-calling.
Inside-the-20 punts force the opponent to start from their own 10-yard line. Touchbacks give them the ball at the 25-yard line. This 15-yard difference is huge.
This 15-yard advantage changes the game. It can shift the expected points for the next drive by over a point. Punters aim for precise placement over long kicks.
The table below shows the difference between a precise punt and a touchback.
| Punt Outcome | Avg. Opponent Starting Field Position | Field Position Swing vs. Touchback | Impact on Drive Expected Points |
|---|---|---|---|
| Punt Downed Inside 10-yard line | Own 8-yard line | +17 yards | -1.4 points for offense |
| Punt Downed Inside 20-yard line | Own 14-yard line | +11 yards | -0.9 points for offense |
| Touchback | Own 25-yard line | 0 yards (Baseline) | 0.0 point change |
| Punt Returned to 35-yard line | Own 35-yard line | -10 yards | +0.7 points for offense |
Elite net punting comes from mastering hang time, direction, and placement. It’s the best way to control the starting field position. This approach, focusing on precision over distance, wins the hidden yardage battle.
Returns & Coverage: lanes, missed tackles, explosive rates allowed/created
Return and coverage units play a big role in football. They can gain or lose yardage through specific actions. We can measure their performance by looking at how well they follow lanes, tackle, and make plays.
For return units, it’s all about lane development. Blockers need to create and keep running paths open. If lanes are not consistent, returners have to wait, losing speed and distance.
The explosive rate created shows how often returns are big. A kickoff return of 25 yards or more is considered explosive. For punts, it’s 10 yards or more. A high explosive rate means the return unit often gives the offense great field position.
The kickoff return EPA is a key metric. It shows the expected points a team gets from returning a kickoff versus taking a touchback. A positive kickoff return EPA means the special teams unit is helping the offense a lot.
Coverage units are judged by how well they stop big returns. A missed tackle often leads to a big return. Counting these tackles per game shows how well the unit is doing.
The explosive rate allowed shows how often coverage units give up big returns. A high rate means they’re not doing their job. It often means they’re missing tackles a lot.
Coverage success looks at the outcome of kicks. For kickoffs, it’s a touchback, fair catch, or tackle inside the 25-yard line. For punts, it’s a fair catch, downed kick, or tackle inside the 15-yard line. A high success rate means the unit is doing its job well.
A high coverage success percentage shows a unit that consistently does its job. It keeps opponents deep or stops returns. By looking at lanes, tackles, and explosive rates, we get a clear picture of a unit’s strengths and weaknesses.
Fake Threats & Blocks: tendencies, protection checks
Fake threats and blocked kicks can change a game’s outcome quickly. They use deception and timing to find weaknesses in the opponent’s defense. To succeed, teams must study their own and the opponent’s tendencies closely.
Coaches look at game footage to spot fake punt or field goal attempts. They watch for specific down and distance situations, like fourth-and-short near the 40-yard lines. Field position and sideline signals also give clues about an opponent’s plan.

Defensive teams use this knowledge to call for aggressive blocks. For the kicking team, perfect protection is essential. The offensive line and personal protector must check for rushers and communicate before the snap.
If these checks fail, the block rate goes up. This rate shows how often an opponent’s punts or field goals are blocked. A high rate means a team’s protection scheme or snap timing has a flaw.
- Down & Distance: Fourth-and-1 to 3 is a prime fake situation.
- Field Position: The 50-yard line is a common launch point.
- Protection Gaps: Overloaded rushers on one side create vulnerability.
- Snap Timing: A slow operation gives rushers a critical advantage.
This analysis is similar to recognizing AI-powered deception in cybersecurity. In football, studying game footage helps teams prepare for game-changing plays. Players must recognize formation tells and offensive line splits for all-out block attempts.
Tracking an opponent’s historical block rate shows their protection unit’s reliability. A team with a rising block rate is a target for aggressive pressure. On the other hand, a team with a near-zero block rate shows disciplined protection and solid fundamentals.
Winning in special teams means being ready for these critical moments. Understanding tendencies and executing protection checks are key to preventing disaster and creating opportunities.
Complementary Football: how ST sets up offense/defense
The battle for starting field position is key in football. It connects all three game phases. Special teams play a big role in setting up the offense and defense.
A strong punting and coverage unit gives the defense an edge. It makes the opponent start their drives far from their goal. This means they need more plays to score, which helps the defense.
On the other hand, a good return game helps the offense. It means they start closer to the opponent’s goal. This lets the offense play more aggressively and score more easily.
The average starting field position is a key season-long stat. Just ten yards per drive can make a big difference. Over time, this extra yardage adds up to more points.
The table below shows how field position can impact the game:
| Average Starting Field Position Advantage (Yards) | Estimated Points Per Game Impact | Season Win Probability Shift |
|---|---|---|
| +5 Yards | +3.1 Points | +12% |
| +10 Yards | +6.5 Points | +25% |
| +15 Yards | +9.8 Points | +38% |
Elite special teams are vital in football. They help one team control the game. A good game plan relies on this advantage.
Coaches who excel in special teams don’t leave success to chance. They plan every kick, coverage, and return. Every yard matters in the fight for points and wins.
Watching a team’s starting field position battle shows their football skill. It’s a sign of their overall team efficiency and success.
Weekly Checklist: 8 numbers to log during broadcasts
Real-time special teams evaluation becomes systematic by recording eight critical numbers each game. This checklist converts complex metrics into a straightforward fan audit tool. Track these data points during Florida Gators broadcasts to quantify hidden yardage.
Consistent logging reveals patterns and strengths. The following ordered list provides a clear sequence for observation. Each item corresponds to a core special teams metric.
- Average Starting Field Position After Kicks. Log where the Gators’ defense and the opponent’s offense begin each drive following a kickoff or punt. This directly measures the starting field position advantage or deficit created by the kicking units.
- Net Punting Average. Calculate the difference between the punt’s gross yardage and the return yardage allowed. A positive net punting figure indicates the unit is winning the field position battle. Note any punts downed inside the 20-yard line.
- Field Goal Make/Miss by Distance Band. Record the result of every field goal attempt. Categorize attempts by short (under 40 yards), medium (40-49 yards), and long (50+ yards) to assess the kicker’s field goal probability at various ranges.
- Presence of a Blocked Kick. Note any punt, field goal, or extra point that is blocked. This single event significantly impacts a team’s seasonal block rate. Document whether the block was due to protection failure or a great individual effort.
- Number of Explosive Returns Allowed. Tally kickoff or punt returns surrendered that gain 20 or more yards. This metric inversely relates to coverage success. High counts indicate breakdowns in lane discipline or tackling.
- Number of Explosive Returns Created. Count the Gators’ own returns that gain 20 or more yards. This offensive production from special teams feeds directly into the kickoff return EPA calculation, signaling a momentum shift.
- Missed Tackles on Coverage Units. Keep a separate tally for missed tackles during punt and kickoff coverage. A high number correlates directly with the explosive returns allowed, showing poor coverage success.
- Kickoff Touchback Rate. Track the number of kickoffs that result in touchbacks versus returns. A high touchback rate can be a strategic choice to neutralize a dangerous returner, affecting the opponent’s starting field position.
This checklist serves as a practical framework. It transforms passive viewing into an analytical exercise. Fans gain a deeper, quantifiable understanding of the game’s third phase by focusing on these outcomes.
Next Opponent: ST strengths/weaknesses to watch
Scouting future opponents is part of the weekly analysis. Florida Gators fans can get ready by looking at an opponent’s special teams. This helps find hidden advantages in the game.
It’s important to check an opponent’s coverage success in kickoffs and punts. These stats are found in NCAA and SEC reports. A low ranking means they might be open to big returns. A high ranking shows they’re well-disciplined.
Also, look at the opponent’s block rate. This shows how often they block kicks or punts. It also shows how often their kicks get blocked. A high block rate means Florida’s teams need to be extra careful.
Check the placekicker’s success rate from different distances. Look at game logs for patterns in hash splits and pressure kicks. See how often the punt returner makes big returns. A high rate means Florida’s coverage teams need to stay focused.
By gathering this information, you get a detailed scouting report. It points out where Florida’s special teams can win. This analysis turns weekly tracking into a strategic preview.