

This hub is your go-to for in-depth analysis of Florida’s top NCAA football teams. It dives deeper than just scores and headlines. You’ll get a closer look at what happens on the field.
It’s aimed at fans aged 18-34 who want more than just the basics. They prefer facts over rumors.
Our goal is to give you the real story on team and player stats. We promise to share information without bias.
Expect to see advanced stats, weekly breakdowns, and long-term trend analysis. We focus on Florida’s major college teams. You can count on us for reliable data every week.
Quick Metric Glossary: EPA, success rate, explosive plays, havoc, PFF-style grades, passer efficiency
Advanced football analytics use specific, measurable metrics to go beyond old stats. This glossary explains the main terms used here. Knowing these concepts helps understand player and team data well.
Expected Points Added (EPA) per play shows how much a play changes a team’s scoring chance. It compares the expected points before and after the play. A positive EPA/play means the play helped the team’s scoring chances.
Success rate shows the percentage of plays that meet a yardage goal. For standard downs, a play is successful if it gains 50% of the yards needed for a first down. On third or fourth down, success means gaining 100% of the needed distance. This rate shows how consistent an offense is and how well a defense stops them.
Explosive plays are runs over 12 yards and passes over 16 yards. These plays greatly change the game’s direction. Tracking explosive plays helps find out who can make big plays and who can’t stop them.
Havoc rate is a defensive metric that combines tackles for loss, passes defensed, and forced turnovers. It shows the percentage of plays where the defense disrupts the offense. A high havoc rate means a defense is doing well and stopping the offense.
PFF-style grades evaluate player performance snap by snap. Experts review each play and give a score based on how well a player did their job. These grades consider the play’s difficulty, giving a detailed view of player performance.
Passer efficiency rating measures how well a quarterback does. It combines stats like completion percentage, yards per attempt, touchdowns, and interceptions. This rating is key for judging a quarterback’s overall passing skill.
| Metric | Definition | Primary Use |
|---|---|---|
| EPA/Play | Change in expected points from one play. | Evaluating play impact and decision-making. |
| Success Rate | Percentage of plays gaining required yardage. | Measuring offensive consistency and defensive stops. |
| Explosive Plays | Runs ≥12 yds, Passes ≥16 yds. | Identifying big-play ability and defensive gaps. |
| Havoc Rate | % of plays with TFL, PD, or turnover. | Gauging defensive disruption and pressure. |
| PFF-Style Grades | Play-by-play performance score. | Providing contextual player evaluation. |
| Passer Efficiency | Formula combining key passing stats. | Rating quarterback productivity and efficiency. |
These metrics are the basics for all data snapshots. They help analyze Florida college football deeply and fairly. Knowing these terms helps understand weekly trends and player evaluations better.
Team Coverage Map: UF, FSU, Miami, UCF, USF (conference context: SEC/ACC/AAC)
Florida’s college football teams perform differently in their conferences. We focus on five main teams, each in a unique league.
- Florida Gators (University of Florida) – Southeastern Conference (SEC)
- Florida State Seminoles (Florida State University) – Atlantic Coast Conference (ACC)
- Miami Hurricanes (University of Miami) – Atlantic Coast Conference (ACC)
- UCF Knights (University of Central Florida) – Big 12 Conference
- USF Bulls (University of South Florida) – American Athletic Conference (AAC)
Each team’s league is key to understanding their success. It shapes their schedule, the teams they face, and how they’re measured. Success looks different in each league.
The Florida Gators play in the SEC, the toughest league in the country. They face top teams every week. Their stats are often adjusted for the SEC’s strong defenses and fast-paced games.
The Florida State Seminoles and Miami Hurricanes are in the ACC. This league has both established and rising teams. Their success is often judged on consistency and performance in big games.
UCF joined the Big 12, changing their competitive landscape. Now, they face new challenges in a power conference. USF competes in the AAC, where explosive plays and efficiency are key.
This map covers all of Florida’s college football. It helps understand if a team’s stats reflect their true strength or their league’s influence.
Weekly Update Cadence: Sunday box scores, Monday advanced data, Thursday matchup lens
The Florida College Football Player Performance Hub has a three-part weekly update plan. This plan makes sure fans and analysts get the right info at the best time.
- Sunday: Preliminary box score summary.
- Monday: Advanced metric deep dive.
- Thursday: Upcoming matchup projection.
The first report comes out every Sunday evening. It quickly sums up the weekend’s stats. Scores, yards, turnovers, and player stats are the basics. This gives a quick look before we dive deeper.
Monday’s update is the main analysis. By then, advanced data from Pro Football Focus and Sports Info Solutions is ready. We use EPA, Success Rate, and other metrics to understand the games better. This turns numbers into real insights, showing how teams did beyond the score.
Thursday’s update is the last one of the week. It looks ahead to the weekend’s games. Analysts use all the data to predict key matchups. For example, they compare a team’s pass protection with an opponent’s pressure. Or, they look at a receiver’s yards-after-catch against a defense’s tackling.
This regular publication schedule makes the game cycle into a story. Fans can see how the first results, deeper stats, and future games connect all season.
Offense Snapshot: QB efficiency, WR YAC, RB after-contact, OL pass pro/short-yardage
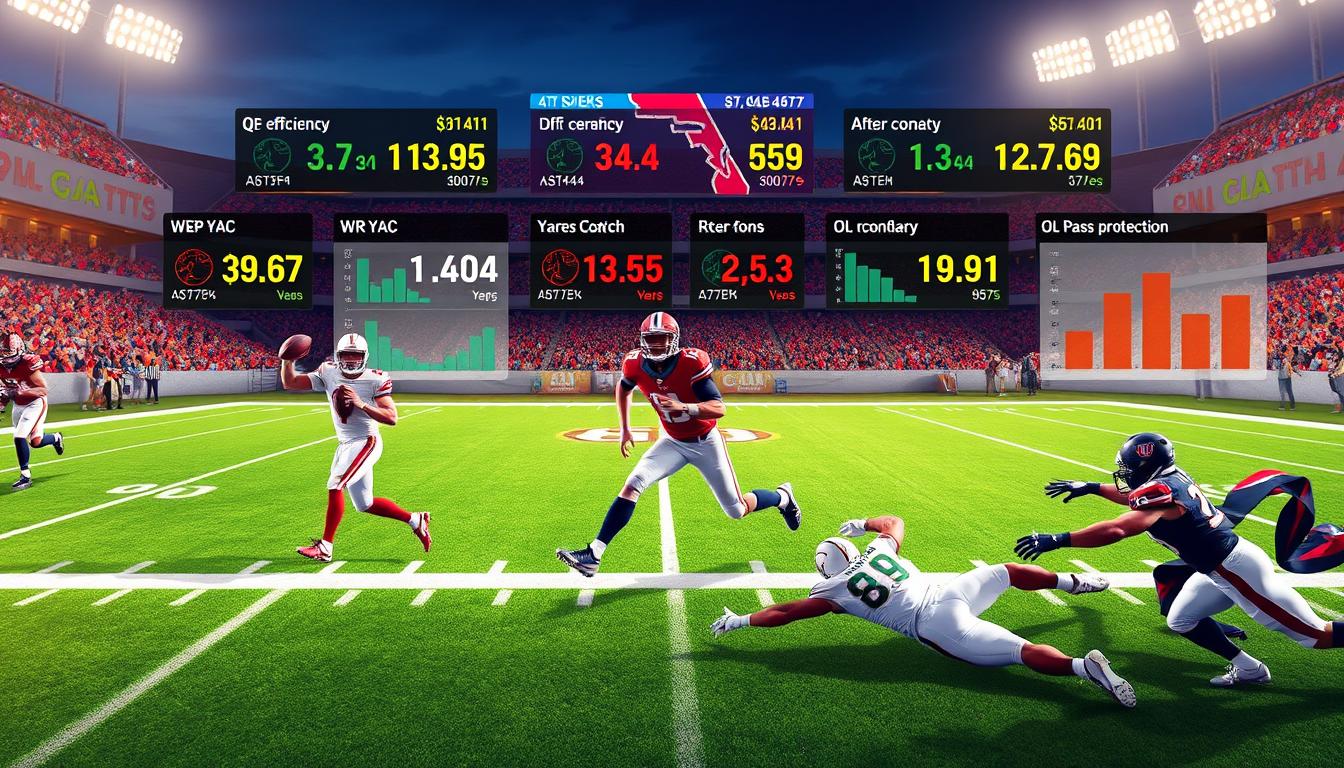
The offensive snapshot looks at four key areas: quarterback play, yards after catch, running back strength, and line performance. It goes beyond just numbers to show how teams score. This analysis gives us the detailed data needed to understand a team’s offense in college football stats.
Quarterback efficiency is about making smart plays and completing passes. Metrics like completion percentage and Expected Points Added on passes are important. A high EPA per dropback shows a quarterback who often makes good plays.
Wide receiver performance is more than just catching the ball. Yards after catch (YAC) shows how well a receiver can gain extra yards after catching a pass. This metric helps us see who is truly dynamic on the field.
Running back evaluation is about physical toughness and consistency. Yards after contact shows a back’s ability to keep going after being hit. Success rate in run schemes shows a runner’s reliability in gaining yards.
Offensive line performance is split into two main tasks. Pass protection win rate shows how well a lineman can block for 2.5 seconds. Short-yardage conversion percentage shows success in tough situations. Both are key for advanced college football stats analysis.
| Team | QB EPA/Pass | WR Avg YAC | RB Yds After Contact | OL Short-Yd Conv % |
|---|---|---|---|---|
| Florida | +0.18 | 5.2 | 3.1 | 72% |
| Florida State | +0.24 | 6.1 | 2.8 | 68% |
| Miami | +0.12 | 4.8 | 3.4 | 75% |
| UCF | +0.20 | 5.6 | 2.9 | 70% |
| USF | +0.08 | 4.5 | 2.5 | 65% |
The table shows key offensive stats for Florida’s top teams. It lets us compare their efficiency and play styles. These college football stats give us a full view of how offenses work, not just the scores.
Defense Snapshot: pressure rate, run-stops, coverage snaps, third-down/red-zone
The defensive snapshot looks at key areas like pressure rate and run-stops. It goes beyond just numbers to see how a team really does. It shows the strengths and weaknesses of a defense clearly.
Pressure rate shows how often the defense gets to the quarterback. This includes sacks, hurries, and hits. A high rate means the offense is making mistakes.
Run-stop percentage tracks when the defense stops the offense from gaining yards. This is key for controlling the game’s pace.
Coverage snaps data shows how well a defense does against passes. Lower numbers mean they’re doing a great job.
Situational efficiency is what sets top defenses apart. Third-down conversion rate allowed shows how well a defense gets off the field. A low rate means they’re doing well in tough situations.
Also, red-zone touchdown percentage shows how a defense does when it’s really important. Stopping touchdowns and forcing field goals is a sign of strength.
Important defensive stats include:
- Quarterback Pressure Rate
- Run-Stop Percentage
- Receptions/Yards Allowed per Coverage Snap
- Passer Rating Against
- Third-Down Conversion Rate Allowed
- Red-Zone Touchdown Percentage Allowed
These stats together give a full defensive snapshot. They show if a team is good at making plays or struggles in big moments. This helps us understand how teams are doing each week.
Special Teams: net field position, FG probability, return explosiveness
Special teams in football offer a clear advantage in net field position and kicking skill. This part of the game greatly affects scoring chances and game control. It’s measured through several important metrics.
Net field position is a key special teams metric. It shows the average starting field position difference between a team and its opponents. A positive number means a team usually gets better field position from kickoffs, punts, and turnovers.
Having better net field position means shorter drives for the offense. It makes scoring more likely and forces opponents to cover longer distances.
Field goal probability shows how likely a kicker is to make a field goal from a certain distance. It takes into account past success, kick distance, weather, and stadium conditions. This probability helps coaches make better decisions during the game.
Good field goal kicking lets teams score from farther away. It can turn stalled drives into points and influence fourth-down decisions.
Return explosiveness looks at the effectiveness of kick and punt return units. It focuses on average return yardage and how often returns go over 20 yards. Explosive returns can quickly change the game’s field position and lead to touchdowns.
Successful return units put pressure on opposing teams’ coverage. It can make them change their kick strategy, leading to shorter kicks or mistakes.
These metrics turn special teams into a measurable part of a team’s efficiency. They are used in team ratings and simulation models. This shows how special teams can give a team an edge in Florida college football.
Schedule + Rankings
Broadcast details, point spreads, and rankings come together in this look at Florida college football next week. This section is a neutral guide for the upcoming games of the state’s covered teams.
The data gives a clear view of each game’s competitiveness and national importance. All info comes from official conference releases and major sports media.
| Team | Next Opponent | Date / Time / TV | Current Rank (AP/CFP) | Spread / Total (O/U) | Depth Chart Note |
|---|---|---|---|---|---|
| Florida Gators | vs. LSU | Sat, 3:30 PM ET / CBS | RV / — | +7.5 / 55.5 | Starting LB status questionable. |
| Florida State Seminoles | at Duke | Sat, 7:30 PM ET / ABC | #12 / #15 | -3.5 / 48.0 | WR2 expected to return. |
| Miami Hurricanes | vs. Georgia Tech | Sat, 12:00 PM ET / ACCN | #20 / #22 | -10.5 / 61.0 | No major changes reported. |
| UCF Knights | at Oklahoma | Sat, 12:00 PM ET / FOX | — / — | +21.0 / 67.5 | Two OL listed as game-time decisions. |
| USF Bulls | vs. FAU | Sat, 7:00 PM ET / ESPN+ | — / — | -2.5 / 52.0 | Secondary depth impacted by injury. |
The point spread and total (over/under) figures are based on market data. They show the expected team strength and game environment. This is not a gambling promotion but a factual report of available data.
AP Poll and College Football Playoff rankings give a national view of each team. “RV” means receiving votes outside the Top 25. A double hyphen shows an unranked status in both polls.
Changes to a team’s depth chart can affect these projections. A key player missing can change the spread. A starter coming back from injury might narrow the expected point difference.
This schedule and ranking data sets the stage for weekly matchup analysis. It provides the basic “who, when, and where” for evaluating on-field performance trends in later sections.
Trendlines: last 4 games, opponent-adjusted performance, home/away splits
Trendline analysis focuses on a four-game sample. It looks at opponent-adjusted metrics and home/away splits. This method gives a clearer view of a team’s true trajectory.
Looking at a team’s last four games helps see their stable performance. A single game can be an outlier. Four games show consistent patterns of improvement or decline.
Raw statistics need context. Opponent-adjusted performance uses power ratings to account for competition quality. A high offensive output against weak defenses is less impressive than moderate success against elite units. This adjustment reveals a team’s true strength.
Performance can vary by venue. Home/away splits examine efficiency differences in different environments. Some teams show significant defensive drops on the road. Others maintain offensive consistency regardless of location.
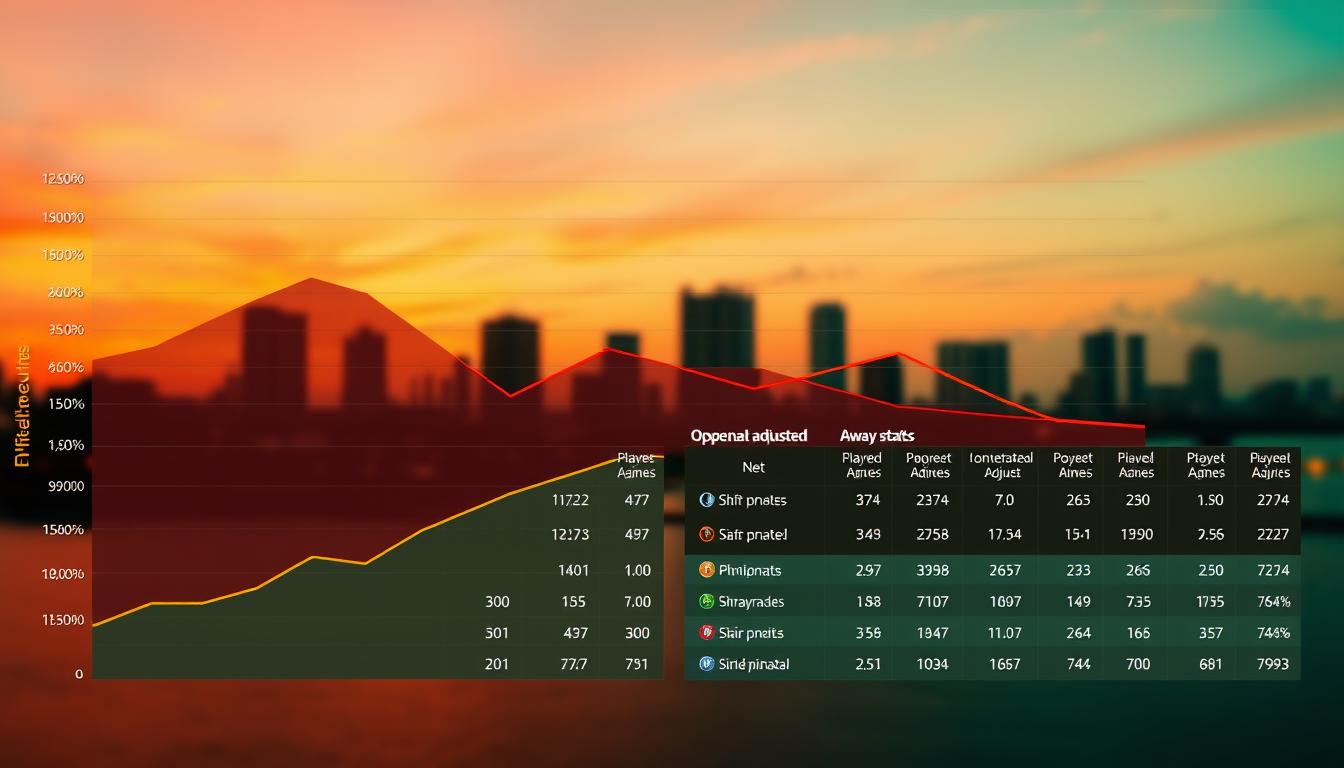
The table below summarizes key trendline metrics for Florida’s primary programs over a rolling four-game window. It includes opponent-adjusted Expected Points Added (EPA) and the difference in performance between home and away games.
| Team | Last 4 Games Record | Avg. Opponent-Adjusted EPA | Home EPA Diff. | Away EPA Diff. |
|---|---|---|---|---|
| Florida Gators | 2-2 | +1.2 | +3.1 | -0.7 |
| Florida State Seminoles | 3-1 | +5.8 | +6.5 | +4.9 |
| Miami Hurricanes | 4-0 | +7.4 | +8.2 | +6.1 |
| UCF Knights | 1-3 | -2.5 | -1.8 | -4.3 |
| USF Bulls | 2-2 | -0.9 | +0.5 | -3.2 |
The Miami Hurricanes show a strong positive trend across all metrics. Their undefeated record in the last four games is supported by a high opponent-adjusted EPA. This indicates their success is not a product of a weak schedule.
The Miami Hurricanes also exhibit notable performance stability. Their away EPA differential remains strongly positive. This suggests their system travels well, a key indicator for future road games.
Trendline data forms a reliable basis for projection. Teams with rising opponent-adjusted metrics and solid road profiles are often better bets. This analysis moves beyond record to reveal the underlying drivers of success.
What’s Sustainable vs. Noise: regression checks, injuries, weather, tempo
The UCF Knights’ recent data shows the difference between real strength and random changes. We use careful analysis to figure out which good performances will keep happening and which won’t.
This method is based on regression to the mean. Teams usually go back to their usual level after extreme results. Finding these extreme results is key to making predictions.
Many outside factors can make data look different each week. We carefully look at these factors to find the real strength of a team.
Key Injuries can really change things. Losing a key player, like a quarterback or a top defender, can greatly affect a team’s performance. We need to consider who’s playing when looking at the data.
Weather Conditions also play a big role. Bad weather can make passing harder and lead to more turnovers. Results from games in bad weather are often not typical.
Play Tempo changes can also affect how we see a team. If a team runs more plays than usual, they might look better in total yards. But, looking at efficiency per play is more important because it’s less affected by how fast the game is played.
The table below shows which metrics are stable and which change a lot.
| Metric Category | Stable (Sustainable Signal) | High-Variance (Often Noise) | Primary Influence |
|---|---|---|---|
| Offensive Efficiency | Success Rate, EPA per Play | Total Yards, Points per Game | Scheme & Talent |
| Defensive Performance | Pressure Rate, Havoc Rate | Turnovers Forced | Play Design & Execution |
| Team Context | Third-Down Conversion % | Red-Zone Scoring % | Coaching & Decision-Making |
| External Factor | Injury Report Status | Single-Game Weather | Uncontrollable Variables |
| Style of Play | Average Depth of Target | Plays per Game (Tempo) | Game Script & Philosophy |
Looking at the UCF Knights means more than just looking at scores. A big game in bad weather doesn’t mean as much as consistent play in good weather.
Consistent defensive pressure is a better sign of future success than a game with many turnovers, which can be random.
Knowing these differences helps us better understand Florida teams in their conferences. It helps us see which teams are really improving and which are just having a lucky streak.
In short, real success comes from doing things well over and over again. Random events or short-term changes are just that. Good analysis focuses on the real trends.
Fan Toolkit: stat trackers to follow live, mobile dashboards, alerts
This hub offers tools for fans to use in real time. A digital toolkit lets fans dive into the data as it happens.
Live trackers and mobile dashboards give fans access to game stats. The Data-Driven Hub offers tools for simulations and mobile use. Fans can see quarterback efficiency, defensive pressure, and special teams performance live.
Custom alerts keep fans updated on key stats or new data. Fans of teams like the USF Bulls get notifications for new stats or milestones. This makes analysis interactive and exciting.
This toolkit changes how fans watch games. It turns reading into an active experience every game day.