

Games are won with defense. Modern football analysis looks beyond scores. It focuses on specific, telling statistics.
This method grades defenses on disruption. The key metrics are tackles for loss (TFLs) and pressure %.
Early spring results give us a glimpse. Florida State’s defensive front made a big impact in a recent scrimmage, said head coach Mike Norvell.
Indiana’s defense showed its strength against FIU. It allowed only 1.8 yards per carry. The unit had eight tackles for loss and four sacks.
Such success comes from the scheme and how well it’s executed. Indiana’s 4-2-5 alignment is key. It dictates how pressure is applied and gaps are managed.
This introduction prepares us for a detailed look at units. We’ll focus on these quantifiable, game-changing actions.
Front Seven: pressure sources, run fit efficiency, short-yardage stops
Disciplined run fits and consistent pressure from defensive linemen are key to a strong defense. The havoc rate measures how well they disrupt the offense. It includes tackles for loss, passes defensed, and forced fumbles.
Good run defense means each player sticks to their gap. This lets linebackers move freely and make plays. Indiana linebacker Aiden Fisher explained, “We’ve been a very explosive defense. Our d-line playing free lets linebackers clean up the mess.”
Staying disciplined leads to better run-stops, like in short-yardage situations. A key sign is how often a defense stops the opponent on third down. Indiana’s defense was impressive against FIU, holding them to just 4 successful conversions on 13 third-down tries.
Pressure can come from unexpected places, not just from edge rushers. Players who can rush and cover add complexity for offenses. Florida’s Rylan Kennedy showed this during spring drills, getting a sack and an interception while covering.
This diverse threat boosts a unit’s havoc rate. It makes offenses worry about where the pressure will come from. When the front seven does its job, linebackers can chase down the ball carrier. This leads to more tackles for loss and fewer successful runs.
Coverage: target map, yards per coverage snap, explosives allowed
The coverage grade by Pro Football Focus shows how good a pass defense is. For example, Indiana got an 80.7 coverage grade last season, ranking 34th. This grade combines several important performance indicators.
A defensive target map shows where quarterbacks often complete passes. It highlights weaknesses or mismatches in the defense’s scheme.
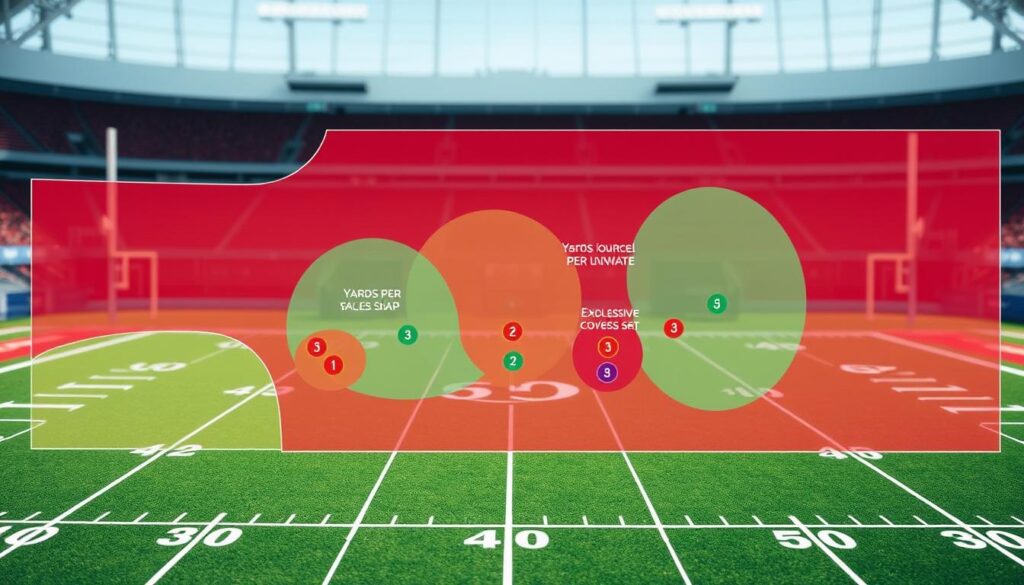
Yards per coverage snap shows how efficient a defense is. It’s the average yards given up each time a defender is in coverage. A lower number means the defense is doing a better job.
The main way to judge coverage is the success rate allowed. It defines a successful play for the offense. A low success rate is a sign of a top-notch coverage unit.
Stopping big pass plays is a key goal for coverage. Coaches like Florida State’s Mike Norvell stress its importance. He says defensive success can turn the game around.
Creating turnovers in coverage is also key. At Indiana, cornerback D’Angelo Ponds made a key deflection that led to an interception. Such plays can change the game’s momentum.
The table below shows how different teams can vary in coverage metrics. It uses hypothetical team data based on common FBS ranges.
| Team Example | Coverage Grade | Yards per Coverage Snap | Explosive Plays Allowed (20+ yd) | Success Rate Allowed |
|---|---|---|---|---|
| Elite Unit | 85.0 | 0.8 | 12 | 38% |
| Average Unit | 72.5 | 1.3 | 22 | 48% |
| Struggling Unit | 62.0 | 1.9 | 35 | 58% |
Tracking these metrics weekly gives a clear view of coverage trends. Analysts and fans can follow performance changes through resources like the Florida college football weekly scoreboard. A consistent, low success rate allowed is key to a strong defense.
Money Downs: third/fourth down and red-zone profiles
Indiana’s game against FIU showed both strengths and weaknesses in key defensive moments. These moments are called “money downs.” They happen on third and fourth downs.
Doing well in these situations is key. It affects who has the ball and where they start. A strong third-down defense leads to punts and ends drives. It’s a key way to measure a defense’s success.
In the game, Indiana’s defense did well against FIU. They allowed FIU to convert only 4 times out of 13 on third down. This 30.8% conversion rate was a good sign. It showed the defense was making smart calls and executing well.
But, there was one big mistake before halftime. On 3rd and 5 with 58 seconds left, FIU’s Kejon Owens ran 23 yards up the middle. The next play, FIU scored a touchdown.
This mistake showed a big point. One mistake on a money down can change the whole game. It can shift the momentum and affect the score.
Red-zone defense is also very important. When an opponent gets to the 20-yard line, the goal changes. The defense aims to limit touchdowns and force field goal attempts.
The red-zone TD rate allowed is a key statistic. It shows the percentage of red-zone trips that end in touchdowns. A rate under 50% is considered top-notch.
Looking at both third-down and red-zone defense gives a full picture. It shows how a defense handles the biggest challenges. These profiles often predict a team’s ability to win close games.
| Defensive Metric | Indiana vs. FIU Performance | Notable FBS Average (2023) |
|---|---|---|
| Third-Down Conversion Rate Allowed | 30.8% (4/13) | ~38.5% |
| Red-Zone TD Rate Allowed | 100% (1/1) | ~55.0% |
| Fourth-Down Stops | N/A (0 attempts) | ~50.0% |
| Points per Red-Zone Trip Allowed | 7.0 | ~4.8 |
The table shows Indiana’s mixed results. Its third-down defense was strong most of the game. But, the one red-zone chance led to a touchdown.
This gives a perfect but misleading red-zone TD rate of 100%. Early in the season, small sample sizes are common. The focus is on the process and execution in each critical situation.
Money downs are key to winning. Success in these situations requires discipline, communication, and awareness from all eleven defenders.
Turnover Math: fumbles vs interceptions, forced vs luck-driven
Understanding the difference between forced and unforced turnovers is key. Not all turnovers are the same. This distinction helps us see a team’s true defensive strength.
Florida State’s defense showed this difference recently. Edge rusher Rylan Kennedy got a sack and an interception. This is a great example of a forced turnover. The pressure from the front seven led to a quick throw and a defensive back’s play.

On the other hand, some turnovers are due to the offense’s mistakes. At Indiana, cornerback D’Angelo Ponds deflected a pass, leading to an interception. The pass was initially accurate, but a deflection and a lucky bounce led to the turnover.
It’s important to know the difference for future evaluations. Forced turnovers like strip-sacks or pressured interceptions are more reliable. They show a team’s scheme, pressure, and coverage discipline. Unforced errors, like a quarterback mistake or a dropped pass, are less reliable.
The following table categorizes common turnover types by their primary driver and sustainability.
| Turnover Type | Primary Driver | Sustainability Indicator | Example Play |
|---|---|---|---|
| Strip-Sack Fumble | Defensive Pressure & Technique | High | Edge rusher defeats blocker, attacks QB’s arm. |
| Pressured Interception | Coverage Confusion & Pass Rush | High | Blitz forces bad throw into tight window. |
| Tip-Drill Interception | Defensive Reaction & Fortune | Moderate | Deflected pass at line, caught by linebacker. |
| Offensive Miscue Fumble | Ball Security Error | Low | Running back drops exchange in clean pocket. |
| Miscommunication Interception | Offensive Route Error | Low | QB and receiver read different coverage. |
A good turnover margin comes from a mix of both types. Top defenses force a lot of turnovers through direct plays. Florida State shows they can make plays and take advantage of mistakes.
Watching turnover numbers each week helps predict a defense’s performance. A team with many sacks and pass breakups is likely to keep making turnovers. But, relying on luck can lead to a drop in performance. The quality of turnovers is as important as the number.
Tempo & Field Position: how pace and ST affect defensive efficiency
Two key factors shape defensive efficiency: offensive tempo and starting field position. Raw stats need context for a fair look. The game’s pace sets the challenges a defense must face.
Defending fast-paced offenses requires quick adjustments. Coaches must simplify plays, limiting complex strategies. This rush makes it hard for defenders to communicate or switch players, leading to mistakes and exhaustion.
Spring drills focus on two-minute scenarios to prepare for this fast pace. The ability to perform well under pressure is what separates good from great defenses.
Starting field position also matters a lot. It’s influenced by special teams and how well a team holds onto the ball. A defense starting far back faces a tough uphill battle.
But, starting with an advantage gives a team an edge. The field is shorter, and the offense has fewer options. This makes it easier for a defense to make a defensive stop.
Coaches practice starting from their own 10-yard line to build resilience. This practice helps teams understand how to play effectively even when they’re in a tough spot.
Field position affects how risky a defense can be. A team starting on its own 10-yard line can’t afford to blitz too much. They need to play it safe, focusing on not giving up big plays.
Special teams play a big role in defensive strategy. Winning the field position battle is key to success. It can turn a good game into a great one.
Looking at defensive performance means more than just stats. The opponent’s tempo and the team’s field position set the stage. True defensive efficiency is seen in this context.
Tackling Trends: miss rates, pursuit lanes, open-field success
Missed tackles are a big problem for defenses. They let offenses move the ball and keep drives going. Good defenses know how to wrap up ball carriers.
“Miss rate” is when a tackle doesn’t stop a runner. A high miss rate means more big plays for the offense. It shows if a defense is solid or not.
How defenders chase and where they go is also key. The right angles can stop runners fast. Staying disciplined helps turn big plays into small ones.
Coach Curt Cignetti talked about Indiana’s mistakes after a game. He said they had sloppy tackling and missed tackles. This shows a problem with basic skills during a big moment.
Numbers back up this point. Pro Football Focus gave Indiana a 79.6 tackling grade. This ranked 24th in the country. It shows how well they tackled.
Defending in open fields is the toughest. It needs good technique and teamwork. Defenses with low miss rates in open fields are well-trained.
Success in open fields comes from:
- Good positioning and control
- Using the sideline to help
- Good communication to avoid chasing too far
To get better at tackling, teams need to practice the basics. Drills on form, leverage, and angles are important. The data and coach’s words show where to improve.
Opponent Fits: spread/tempo vs pro-style, QB run threats
Indiana’s defense showed how to stop a quarterback who loves to run. This success shows a key idea in modern defense: schemes must change every week to match the opponent’s style. The main challenge is to be flexible and switch between different systems.
Effective opponent fits need different strategies:
- Against Spread/Tempo: Defenses focus on getting to the quarterback, using speed on the edges, and good communication. Linemen must keep the rush going to stop the quarterback’s runs.
- Against Pro-Style: The goal is to stop the run, control tight ends, and win one-on-one battles. Keeping your gap discipline is key.
A dual-threat QB can use both spread and pro-style plays. Indiana’s plan against FIU’s Keyone Jenkins was to keep him in check. Coach Curt Cignetti wanted to limit Jenkins, who is good at both passing and running.
The defense did a great job. They put pressure on the quarterback and kept Jenkins from running far. They got four sacks and made Jenkins run for just negative 11 yards on ten tries. His longest run was only four yards.
“Our biggest thing was containing him, knocking him off his rhythm,” said Indiana defender Philip Fisher. The stats showed they did a great job of stopping Jenkins and making the quarterback uncomfortable.
This kind of defensive adaptability is essential. A team that does well against a slow pro-style offense might struggle with a fast spread offense. Being able to adjust and plan well, like against FIU, leads to better defense and wins.
Adjustments: second-half splits, blitz vs drop-8 toggles
Second-half splits show how well a team can adjust and stay strong. The best defenses make key changes at halftime. These changes often win close games.
Indiana’s defense showed this recently. They stopped a scoring drive just before halftime. Then, they shut out the opposing team in the second half. A player said the team played solid defense after the break.
This shows a critical coaching skill: fixing first-half mistakes and making smart changes. Coaches must decide between blitzing or covering up. This choice is key.
Blitzing aims to disrupt the quarterback. It forces quick decisions. On the other hand, dropping eight defenders into coverage aims to limit big plays.
Teams like LSU under coach Blake Baker excel at this. Baker’s players were ahead of Clemson in key moments. This was due to good pre-snap reads and halftime adjustments.
The table below shows notable second-half defensive changes. It shows how tactical shifts can impact the game.
| Team | Pre-Halftime Points Allowed | Post-Halftime Points Allowed | Primary Adjustment | Game Result |
|---|---|---|---|---|
| Indiana | 14 | 0 | Increased coverage shells, reduced blitz frequency | Win |
| LSU | 17 | 7 | Timed pressure on critical downs, mixed coverages | Win |
| Sample Team A | 10 | 3 | Shifted to predominant drop-8 coverage on passing downs | Win |
| Sample Team B | 21 | 14 | Increased blitz rate from secondary, tightened run fits | Loss |
Looking at these splits shows more than just scores. It shows a defense’s ability to learn during the game. A team that gets better after halftime shows strong teamwork and discipline.
The choice to blitz or drop eight is not random. It’s based on the opponent’s tendencies and the game situation. Elite defensive coordination is about making the right call at the right time.
Improving in the second half is a sign of good coaching. It turns weaknesses into strengths. This adaptability is key for winning championships.
What to Track Next Week
Next week, we’ll focus on upcoming evaluations. For Florida State, spring practice is key. We’ll watch how the defense performs against an uncertain offense.
Coach Mike Norvell hasn’t decided on a starting quarterback yet. The battle between Ashton Daniels and Kevin Sperry is ongoing. Indiana’s Curt Cignetti sees this as a chance to grow.
Next week, defensive performance will be under the microscope. We’ll look at how well they create pressure and tackle in open fields. Their success in the red zone and on third downs will also be important. This data will show how the defense is doing.